The Daily Prices & Promotions report provides users with an instant overview of the current market for their licensed categories and data sources. Follow the steps below to learn how to use the report.
Contents:
- Report Tabs
- Report Tabs: Summary
- Report Tabs: Details
- Report Export
- Hints and Tips
Daily Price & Promotion report
Users can utilise this tool in the platform tool to:
- Monitor prices and promotional activity at a SKU level, staying up-to-date with category trends.
- Easily compare price movements and promotional strategy changes across two points in time, such as week on week or year on year.
- Assist in gap analysis by highlighting range gaps or large jumps in price points.
- Assess the compliance of agreed promotions and monitor stock levels based on up-to-date pricing and promotional data.
Report Tabs
Most reports offer tabbed sections, which provide more in-depth results for a given query.
Within the Daily Prices & Promotions report there are Summary and Details tabs that helps users to visualise data easily.
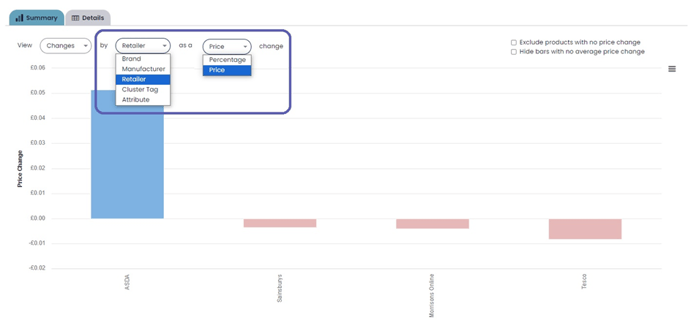
Summary Tab
The Summary tab provides user with an overview of their report by summarising the price changes in easy-to-read charts and graphs. These can be manipulated to suit a users requirements.
Summary Tab: Changes
The Changes tab displays the average price change between the start and end date of your selection, including products that have not changed price.
- The data can be displayed by retailer, brand, manufacturer, cluster tag or attribute.
- Changes can be shown as a price or a percentage.
- Tick "Exclude products with no price change" to remove products that have not changed price.
- Tick "Hide bars with no average price change" to remove blank bars from your report.
Summary Tab: Rankings
The Ranking tab takes only products that are sold in all the retailers in the selection and displays how many products each retailer is selling the cheapest, 2nd cheapest until the last day of the selected date range.
- Changes can be shown as Count or Percentage.
- Click Compare Dates to see how this has changed between the start date and end date of a selected date range.

Summary Tab: Comparison
The Comparison tab takes one retailer as a benchmark and compares against the other retailers in your selection. Here, you can see how many products are cheaper, more expensive, and the same price across retailers.
- Changes can be shown as Count or Percentage.
- Use the against dropdown menu to choose your benchmark retailer.
- Click Compare Dates to see how this has changed between the start date and end date of the selected date range.

Details Tab
The Details tab shows SKU-level pricing information within the criteria used for the analysis.
- The last column displays an average price for the products across chosen retailers showing if this has changed since the beginning of the selected date range.
- Use the View Dropdown Menu to display the cheapest average price across the selected retailers.
- Click the product name for more details of the product including matches, last seen dates, the barcode, and to access the product dashboard.
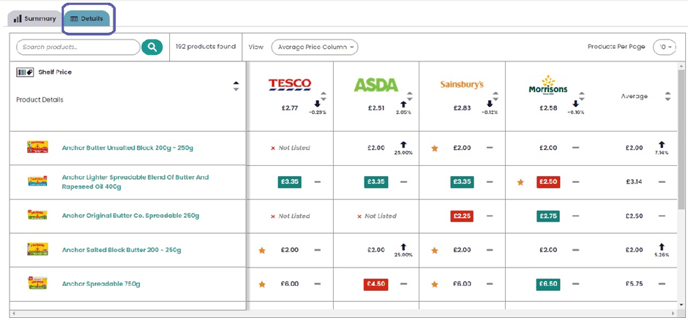
Below each retailer name, the average price for all the products selected is shown. This includes how the average price has changed since the beginning of the selected date range, highlighting which retailer is the cheapest or most expensive across a category or range of products.
Click on any price to display a pricing history for that product.

Detail Tab: Icons
- Prices with a red background indicate the least expensive retailer for the product.
- Prices with a green background indicate the most expensive retailer for the product.
- A highlighted star denotes a promotion.
- Up Arrow indicates the product has increased in price at the retailer since the beginning of the selected date range.
- Down Arrow indicates the product has decreased in price at the retailer since the beginning of the selected date range.
- A blue circular arrow indicates that a product has been relisted during the selected date range.
- A blue arrow indicates that a product is a new listing during the selected date range.
- A red cross indicates that a product has not been listed during the selected date range.
- A grey arrow indicates that a product has been delisted during the selected date range.
Hover over the icons for additional information, such as the price increase in currency or the date of delisting.
Report Export
The analysis can be exported into Excel for additional detail and data manipulation. To do this, simply click ‘Export’ in the top right hand corner and click 'Download'.

- The export has a row for each product and columns for each of the selected retailers, showing the price and any promotions at the start and end dates of the time period selected, plus any price changes.
- Price increases are highlighted in green, and decreases highlighted in red. To look at only the prices which have changed, simply apply a filter to exclude blanks in the Price Changes column.
- There are also columns to the far right of the export displaying data on the Average price and how this has changed.

- When exporting there are additional options which you can select, such as ‘Include all price options’.
- Ticking this box will break out the Base, Shelf, Promoted and Loyalty price of each product.
Daily Prices & Promotions – Hints and Tips
Within the tool:
- Make the aggregated charts more specific by utilising the option to only show items mapped in all retailers. This allows you to see a like for like range comparison between retailers.

- Within the summary tab you can choose to hide bars with no average price change, which will remove any bars that are displaying blank and only return bars that display a result.

- Additionally you can “Exclude products with no price change”, by selecting the tick box on the top right. Doing this will remove those products from the average price change calculation. If the “Hide bars with no average price change” is selected, then this will be removed from the summary.
- Within the details tab, sort prices by retailer by clicking on the retailer logo.

Within the Export:
- Deselect blanks in the latest 'Price' column to remove products not stocked in that retailer.
- Sort each retailer by 'Price Change' or untick blanks to only show products that have had a price change.
- Expand the excel spreadsheet by clicking on the '2' in the top left hand corner. This will provide information on Manufacturer/Brand/EAN/Attributes and a link to the Product Dashboard per SKU.

- Expanding the data will also enable the user to view any additional columns selected when choosing export type, e.g. 'Include all price options'.
Export Options:

- Download an export selecting 'Only show data from the end date' and then press ‘1’ top left and this will simply list the current price across all selected retailers, hiding all other columns.
- '3rd Party Export Mode' downloads as a flat file that can be used to import into other data sources.
- Includes additional information such as product identifiers.
- 'Include Ratio Adjust Column’ includes an additional column showing if a price has been ratio adjusted to match an overall volume.
- 'Include Equivalent Single Price Columns' includes an additional column calculating the single price of items that were on a multi buy promotion.
- 'Include All Price Options’ analyses base price, shelf price, promoted price and loyalty price within the one report.
- 'Include Product Volumes' shows individual product volumes for each retailer.