The Price Index report allows retailers to assess their value position
against their competitors at a total market, sub-category and SKU level.
The integration of sales data enables retailers to have a universal understanding of the figures, and the report can be run including
or excluding promotions. This report is one of Acuity Pricing’s retailer-specific tools.
Contents:
Price Index report
Users can utilise this tool in the platform tool to:
- View price variance by sub-category.
- Set target indexes against competitors at sub-category level.
- Identify areas of the business that are driving the index and/or not meeting set targets.
- Inform decisions on whether to move the prices of particular SKUs and by how much.
- Measure price competitiveness over time via the trended price index.
- Set guidelines on categories to measure the financial impact of products being outside agreed thresholds.
Report Tabs
Within the Price Index report there are tabs for each of the retailers chosen for the report query.
The Price Index report shows the performance of any retailer compared with its competitors.
Users are able to analyse data down to sub-category level to understand which pricing points are not meeting desired targets (e.g. if the company target is to always be 5% more than another retailer, then a target of 105% can be set).

- Each competitor retailer is split out on a separate tab. The contextual retailer is not selectable.
- The category tree can be broken down to analyse the index to sub-category level to identify issues.
- Index for the two time points. The most recent date is displayed first.
- Numeric change to the index between the two dates.
- Target index set for the category or categories. This defaults to 100, but can be set by the user.
- Variance to the index target set and by how much.
Green = over indexed. Red = under indexed.
Calculation for Price Index
- Price Index for a single category: (sum of all contextual prices / sum of all competitor's prices for each product) *100)
- If the account has Unit Sales, Price Index can be weighted. The calculation is as follows: (sum of contextual prices * volume unit sales ) / ( sum of competitor's prices * volume unit sales) *100)
Trended Index
The Price Index allows a retailer to view movements between two points in time.
The Trended Index instead allows a retailer to view movements over time and understand if their price strategy is having an effect versus the competition.
Depending on the licensed options, you can also set thresholds and index by product attribute.

Once the data is analysed a summary tab (A) will appear along with chart icons on each tab. By clicking on the chart icon (B) a trended index chart will appear summarising all competitor retailers.
The chart can be run at any level of the category hierarchy selected.
By switching tabs to a specific retailer the chart will update to reflect this.

Product Count View
Product Count enables retailers to set customisable guidelines to assess where they are outside of agreed thresholds versus the competition e.g. “products that are >10% more expensive than the competition”.
Product count can be viewed as a standard index, or as a trended view.
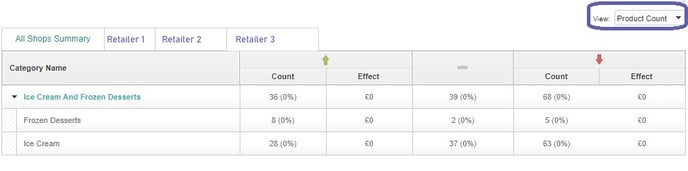
All Shops Summary
The All Shops Summary tab displays the topline index and product count (if licensed) for the selected competitor retailers. This can be branched out to the sub-categories that sit beneath the main category.

Price Index Export
As with all Acuity Pricing reports, the user has the ability to export the Price Index into Excel to view a more detailed analysis.
The Price Index export enables the user to drill down to SKU level and compare matched products with their competition to understand what is driving the index at a more granular level.

Price Index – Hints and Tips
Within the tool:
- Run the index at the parent category level, this takes slightly longer but means you can then branch the category out into its constituent parts, and understand the drivers behind the topline index.

Price Index can be run in conjunction with the premiumisation tool in Strategic Pricing. Use the latter to detect price outliers versus a competitor and the former to then focus in on those lines in more detail.


Within the Export:
- Filter on the 'Index' column for the latest date and select the index outliers (over and under 100).
- Analyse the affected products alongside their competitor matches to ascertain what is causing the index discrepancy.

- To see all products within the export, and identify reasons why they are not filtering into the index, for example volume mismatched products that are not directly comparable, use the custom exports options:
- Select 'SKU Result Code'
- Deselect 'Show Valid Matches'
